
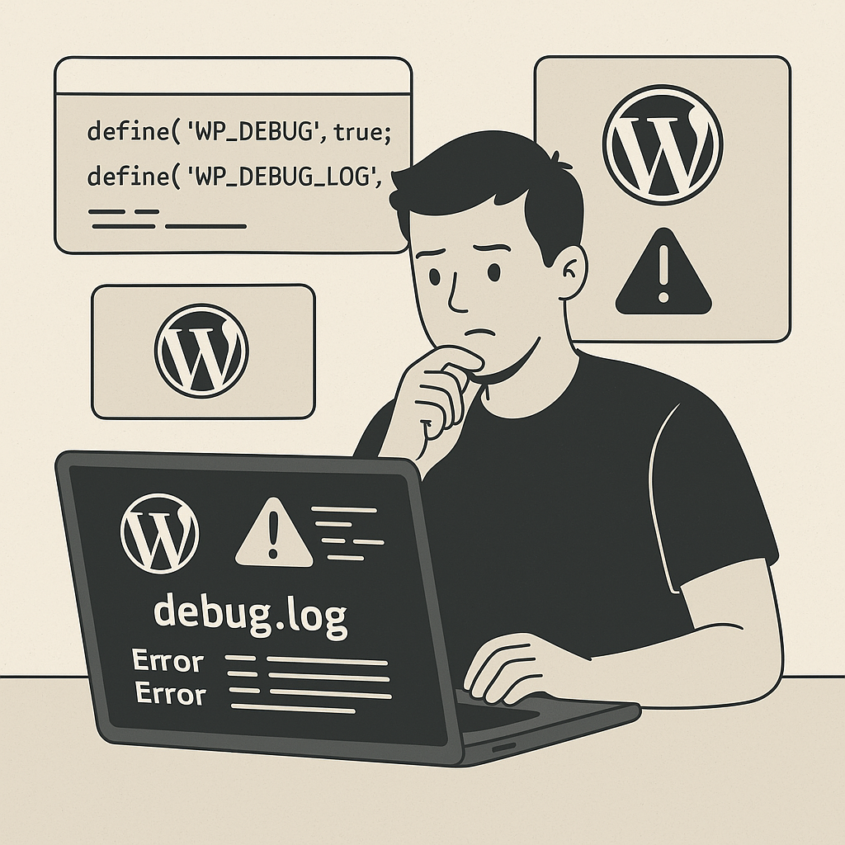
Are you running into mysterious issues on your WordPress site? Perhaps your website has suddenly gone blank, a plugin has stopped working properly, or you’re facing cryptic error messages. These problems can be frustrating, especially if you’re not sure where to start. Thankfully, WordPress includes a built-in system for tracking and logging errors that can point you in the right direction. These are known as WordPress error logs, and in this guide, we’ll explain exactly what they are, how to find them, and how to use them to fix issues on your site.
This tutorial is written specifically for beginner to intermediate WordPress users — people who manage or maintain their own websites, freelancers who care for client sites, and even aspiring developers getting familiar with WordPress under the hood. If you’re comfortable installing plugins or making small code changes like editing the wp-config.php file, this guide is perfect for you.
What Is a WordPress Error Logs and Why Should You Care?
Imagine a behind-the-scenes diary where your WordPress site secretly jots down every technical hiccup it encounters. That’s essentially what an error log is. These logs record error messages that occur while your site is running. They can include anything from minor PHP notices and warnings to more serious issues that cause parts of your site to stop working entirely.
Some of the most common problems error logs can help you diagnose include:
- The infamous white screen of death
- Fatal PHP errors that crash your site
- Plugin conflicts that prevent features from working
- Theme-related bugs that affect the design or layout
- JavaScript or AJAX issues that break forms or interactive elements
- Errors triggered after WordPress core or plugin/theme updates
By reading your WordPress error logs, you can quickly narrow down where a problem is coming from and what might be causing it. Instead of guessing or wasting time trying random fixes, you’ll have a much clearer picture of the situation.
Step 1: Enable Debug Mode in WordPress
Before WordPress can begin collecting error messages, you need to tell it to start logging them. This process is called enabling debug mode. There are two main ways to do this: using a plugin or editing a core file manually.
Enabling Debug Mode Using a Plugin
This method is ideal if you still have access to your WordPress admin area and prefer to avoid working with code. There’s a free plugin called WP Debugging that takes care of everything for you.
To get started:
- Log in to your WordPress dashboard.
- Go to the Plugins section and click Add New.
- Search for “WP Debugging.”
- Click Install Now, then Activate the plugin.
Once activated, the plugin will automatically turn on debug mode and begin capturing errors in a special log file. It’s a simple, user-friendly way to get started with debugging, especially for non-technical users.
Enabling Debug Mode Manually via Code
If you’re unable to access your WordPress dashboard — for example, if your site is broken — or if you want more control over the process, you can enable debug mode by editing your site’s configuration file.
Here’s how:
- Use an FTP client (like FileZilla) or your web hosting control panel (like cPanel) to access your site files.
- Locate the
wp-config.phpfile in the root directory of your WordPress installation. This is the same folder that contains wp-content, wp-admin, and wp-includes. - Open the
wp-config.phpfile in a plain text editor. - Look for the line that says:
/* That's all, stop editing! Happy publishing. */- Just above that line, add the following code:
define( 'WP_DEBUG', true );
define( 'WP_DEBUG_LOG', true );
define( 'WP_DEBUG_DISPLAY', false );
This code enables debug mode, tells WordPress to log all errors, and hides those errors from being displayed on your live website, which is important for security.
Step 2: Locate the Error Log File
Once you’ve turned on debug mode, WordPress will start collecting error messages and storing them in a file called debug.log. This file is located in the wp-content folder of your site.
To access it:
- Use your FTP client or hosting File Manager to navigate to the
wp-contentfolder. - Inside that folder, look for a file named
debug.log.
If the file isn’t there yet, don’t worry. It simply means no errors have been logged yet. Once an error occurs, WordPress will automatically create the file.
To view the log, you can download it to your computer and open it in any text editor. The log will contain a list of errors, warnings, and notices that have occurred since debug mode was enabled.
Step 3: Reproduce the Problem to Generate Errors
The error log won’t contain any useful information until an error actually occurs. If you’re trying to diagnose a specific issue, you’ll need to trigger the problem again after enabling debug mode. For example:
- Visit a page on your site that previously returned a white screen.
- Use a feature that was throwing an error or behaving unexpectedly.
- Reactivate a plugin that was causing trouble.
By recreating the problem, you prompt WordPress to log any related errors, which will then appear in the debug.log file. This is a crucial step — don’t skip it.
Step 4: Read and Understand the Error Messages
Now that your debug.log file contains error messages, it’s time to decode what they mean. Each line in the log follows a general format and contains useful clues.
Here’s a sample log entry:
[28-Mar-2025 14:23:01 UTC] PHP Warning: Undefined variable $foo in /home/your-site/public_html/wp-content/plugins/example-plugin/example.php on line 42This tells you the following:
- Date and time of the error: March 28, 2025 at 14:23 UTC.
- Type of error: In this case, it’s a PHP Warning.
- Message: The variable
$foowas used without being defined first. - File and line number: The problem occurred in
example.phpon line 42.
This format is consistent across most entries in the log. By scanning through the file, you’ll often see repeated errors, which usually means they’re the source of the issue you’re trying to fix.
Common error types include:
- Notice: Informational messages about minor issues. They usually don’t break your site but could be optimized.
- Warning: More serious than a notice. They may cause parts of your site to behave incorrectly.
- Fatal Error: A critical problem that stops part of your site (or all of it) from loading.
If you’re not sure what a particular error message means, copy it and search online — chances are someone else has encountered the same issue.
Step 5: Fix the Problem or Get Help
Once you understand what’s going wrong, you can begin troubleshooting.
If the error is coming from a specific plugin or theme, try deactivating it temporarily to see if the issue disappears. You can also try updating it to the latest version or checking the developer’s support forums for known issues.
If the problem is related to code you added yourself, such as in the functions.php file, review the affected lines and see if you can fix or remove them. Even small syntax errors (like missing semicolons or typos in function names) can cause big problems.
Don’t forget to always create a full backup of your site before making any changes. That way, if something goes wrong, you can quickly restore your site to a working state.
If you’re stuck or unsure how to proceed, you have options:
- Ask for help in the WordPress.org support forums
- Contact your hosting provider — many offer WordPress-specific support
- Hire an expert through our maintenance services to handle it for you
Step 6: Turn Off Debug Mode
After you’ve fixed the problem and no longer need to log errors, it’s important to turn off debug mode. Leaving it on can expose sensitive information about your site’s structure or server setup, which could pose a security risk.
To turn it off, simply reverse the steps you used to enable it. If you used the WP Debugging plugin, go to the Plugins screen in your dashboard and deactivate it.
If you edited the wp-config.php file, open it again and change the debug lines to:
define( 'WP_DEBUG', false );
define( 'WP_DEBUG_LOG', false );
define( 'WP_DEBUG_DISPLAY', false );
This will stop WordPress from logging any more errors and keep your site running smoothly.
Bonus Tips for Smarter Debugging
As you get more comfortable with error logs, there are a few advanced techniques you might explore. For example, you can:
- Use the
Query Monitorplugin for live debugging and insights - Protect your debug.log file from public access using
.htaccess - Log messages manually in your code using
error_log() - Set up log rotation or cleanup jobs to prevent large log files from building up over time
These tips are helpful as you move beyond basic debugging and into more advanced site management.
Final Thoughts: Why This Skill Matters
Learning how to find and read WordPress error logs is one of the most valuable troubleshooting skills you can have. It helps you solve problems faster, maintain a healthier website, and avoid costly downtime or professional repair fees. Best of all, it gives you more confidence in managing your WordPress site.
Whether you’re just trying to fix a broken plugin, learn the basics of development, or impress clients by solving their problems quickly — understanding error logs puts you one step ahead.
Want more tutorials like this? Explore our full library of beginner-friendly WordPress guides, or let our experts handle the hard stuff so you can focus on growing your site.
You’ve got this!